I have an Alcatel MW41 mobile hotspot. It works fine, but it seems to have some firmware running on it (more specifically, it’s running a web server to give you an interface to change different options), which raises two questions: 1) does it run Linux? and 2) can we get root on it?
Some research led me to find that it did, in fact, run Linux. Not only that, but there was a tool that would just give me root access to the hotspot, by the name of TCL-SWITCH-TOOL! 1 Apparently, this tool relied on the fact that the hotspot showed up as an external disk when you connect it to a computer. It did something that switched the hotspot into a debug mode, giving you a root shell.
The tool is Windows-only, but it’ll probably just work under Wine, right? I downloaded the tool, ran it, hit the “switch to debug mode” button, and….
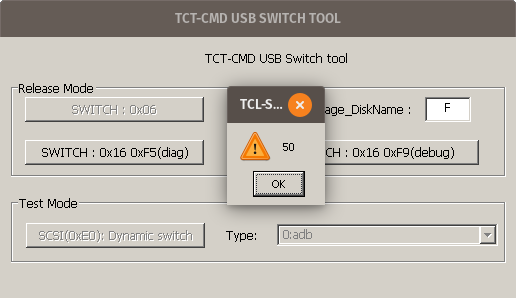
“50”.
“50”. Hmm. Closing that message gave another error:
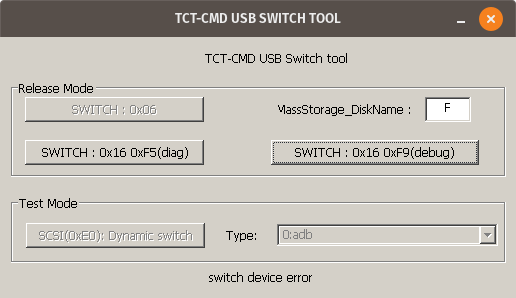
(it didn’t work)
And, in the terminal I used to run the program, I saw a warning message: 0009:fixme:ntdll:server_ioctl_file Unsupported ioctl 4d014 (device=4 access=3 func=405 method=0). This seems to suggest that the program relies on some feature that Wine doesn’t support fully.
At this point, I could probably find an actual Windows computer and just use that. But that’s no fun! Can we figure out how this program works, and replicate it ourselves?
What does it even do?
I decided to open the program in Ghidra, a reverse engineering tool. Searching for the error message from before, “switch device error”, I found that there were multiple references to the string, and they all seemed to be part of relatively complex functions. It would definitely be possible to analyze what the program is doing this way, but is there an easier method?

As shown in the XREF list, there are four different functions that refer to this string.
Well, given that the program asks for the drive letter corresponding to the hotspot, it seems reasonable to assume that it’s somehow sending some special command to the drive over that existing connection (as opposed to, say, some weird custom USB protocol). This seems to be confirmed by the presence of the string \\.\PHYSICALDRIVE%c, which presumably is some way to directly access the drive?

The mysterious \\.\PHYSICALDRIVE%c string.
Let’s assume that the program somehow opens the drive and then does some magic incantation to switch the hotspot into a debug mode. No matter how complicated TCL-SWITCH-TOOL is, at the end of the day, both of those operations will eventually need to go through the Windows API, which is external to this program.
We can monitor those API calls by using Wine’s debug options to enable the relay debug channel. This logs every time TCL-SWITCH-TOOL makes a function call to an external library (what Windows calls a DLL). The hope is that we’ll see the function calls to whatever Windows DLL is responsible for opening the drive and sending those commands. That should then give us a better idea of what the program is actually doing. 2
So, I ran WINEDEBUG=relay wine TCL-SWITCH-TOOL.exe &> tcllog.log, typed in the drive letter, and hit the button to switch the hotspot into debug mode. This resulted in a rather large log file. 3 I searched for the PHYSICALDRIVE string from before, and…nothing. Since that didn’t work, I decided to look for the drive letter I used (F), figuring that the tool probably had to somehow communicate the selected drive letter to Windows.
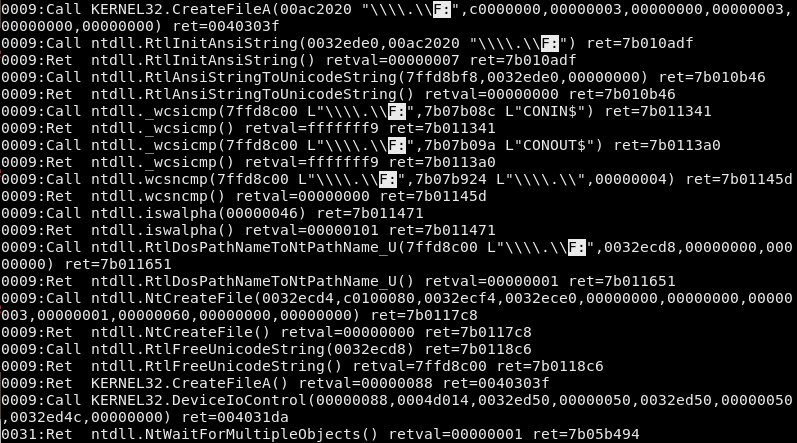
The various function calls logged by Wine.
That actually seemed to work! In this log, each line corresponds to either a function call (labeled as Call) or a function returning (labeled as Ret). At the top, you can see that TCL-SWITCH-TOOL calls CreateFileA, part of KERNEL32, on \\.\\F:. 4 Then, Wine’s implementation of KERNEL32 makes some function calls of its own and finally decides to return a value. (that’s the 009:Ret KERNEL32.CreateFileA() line at the bottom) After that, TCL-SWITCH-TOOL decides to make another call, this time to KERNEL32’s DeviceIoControl function, which seems like what we’re looking for. And, this function call has one parameter equal to 4d014, which matches the error message we got from Wine all the way at the beginning! 5
So, what is DeviceIoControl? Looking at the official Microsoft documentation, it seems to be a fairly generic function that does something based on the dwIoControlCode parameter. 6 In our case, dwIoControlCode is 0x4d014, corresponding to IOCTL_SCSI_PASS_THROUGH_DIRECT, which, according to that page, “allows an application to send almost any SCSI command to a target device.”
Finding the command
By this point, it seems likely that this is the magic debug mode incantation. But what’s the actual SCSI command? Going back to Ghidra, we can pull up DeviceIoControl, and see where it’s called from. 7
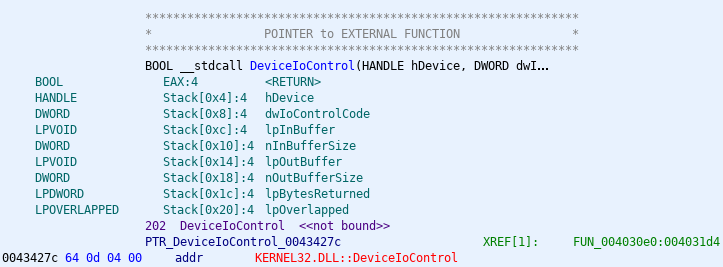
The reference to KERNEL32.dll’s DeviceIoControl.
The thing that says XREF, on the right, tells us that this function has one reference in the entire program. (that is, it’s only used once) Double-clicking on that gives us the code that makes the DeviceIoControl call:
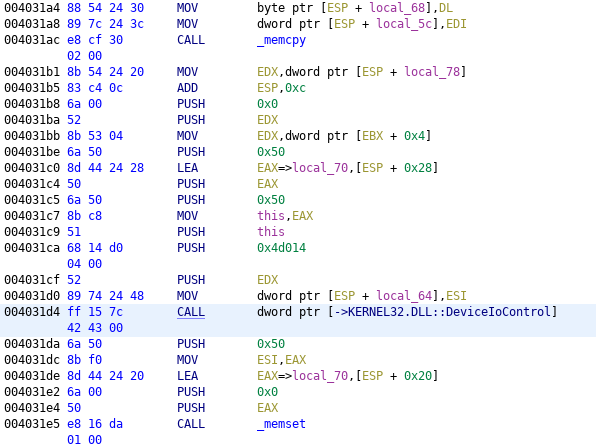
The one usage of DeviceIoControl.
At this point, we could go through the assembly in Ghidra and determine how the various arguments to DeviceIoControl are constructed. However, there’s an easier way. We know now that the function call is at address 0x4031d4. So, we can use Wine’s debugger to set a breakpoint at that address, run the program, and then, once it hits our breakpoint, print out the various arguments. 8
So, I ran winedbg --gdb TCL-SWITCH-TOOL.exe, used the b *0x4031d4 command to set the breakpoint, and tried the program again.

Setting (and hitting!) the breakpoint.
It hit the breakpoint! Now, how do we know what the arguments are?
On Windows x86 systems, the cdecl calling convention is used. 9 That means our arguments should have been pushed to the stack. Using GDB, we can take a look at the stack’s current contents: 10

The contents of the stack.
We can match these values to the arguments of DeviceIoControl (which, again, you can find on this page). The IOCTL_SCSI_PASS_THROUGH_DIRECT page tells us that it takes the command to send from the input buffer, which should correspond to DeviceIoControl’s third argument, lpInBuffer. In our case, the third argument is 0x32ed90. The fourth argument, nInBufferSize, tells us how large that input buffer is, which in our case is 0x50 bytes. So, let’s look at 0x50 bytes from 0x32ed90:

The contents of lpInBuffer.
So is this the magic command? Well, the IOCTL page from before tells us that this should actually be a SCSI_PASS_THROUGH_DIRECT struct.
typedef struct _SCSI_PASS_THROUGH_DIRECT {
  USHORT Length;
  UCHAR  ScsiStatus;
  UCHAR  PathId;
  UCHAR  TargetId;
  UCHAR  Lun;
  UCHAR  CdbLength;
  UCHAR  SenseInfoLength;
  UCHAR  DataIn;
  ULONG  DataTransferLength;
  ULONG  TimeOutValue;
  PVOID  DataBuffer;
  ULONG  SenseInfoOffset;
  UCHAR  Cdb[16];
} SCSI_PASS_THROUGH_DIRECT, *PSCSI_PASS_THROUGH_DIRECT;
We can match the fields of the struct with the data we dumped out from GDB. 11
| Field | Data |
|---|---|
| Length | 0x2c 0x00 |
| ScsiStatus | 0x00 |
| PathId | 0x00 |
| TargetId | 0x00 |
| Lun | 0x00 |
| CdbLength | 0x0c |
| SenseInfoLength | 0x1f |
| DataIn | 0x01 |
| PADDING | 0x00 0x00 0x00 |
| DataTransferLength | 0xc0 0x00 0x00 0x00 |
| TimeOutValue | 0x64 0x00 0x00 0x00 |
| DataBuffer | 0x2c 0xee 0x32 0x00 |
| SenseInfoOffset | 0x30 0x00 0x00 0x00 |
| Cdb | 0x16 0xf9 0x00 0x00 0x00 0x00 0x00 0x00 0x00 0x00 0x00 0x00 0x00 0x00 0x00 0x00 |
Note that we have to include three bytes of padding (labeled PADDING) because Microsoft’s C compiler has to align DataTransferLength to be on a four-byte boundary.
Replicating the command
Now that we’ve deciphered the struct, what is this struct telling Windows to do? Most of the fields aren’t relevant, but what’s important here is Cdb, which, according to the documentation, “specifies the SCSI command descriptor block to be sent to the target device.” In other words, this should be the command that switches the hotspot into debug mode! Then, after sending that command, since the DataIn flag is 0x01 (equivalent to SCSI_IOCTL_DATA_IN), Windows will read 0xc0, or 192, bytes (the value of DataTransferLength) from the device. 12
Some research pointed me to the sg_raw command, which is how you can send arbitrary SCSI commands on Linux. 13 Using the value from Cdb, the command to use should be sudo sg_raw /dev/sgX 16 f9 00 00 00 00 00 00 00 00 00 00 00 00 00 00 -v, where X is the number corresponding to the hotspot’s disk. 14 I tried it, and:
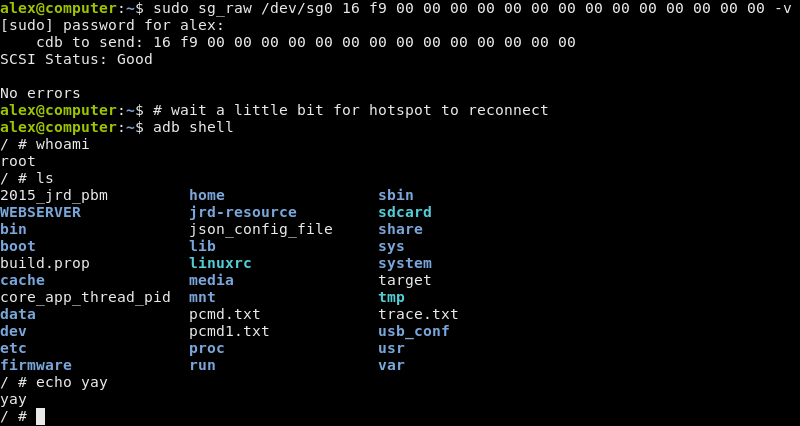
Success!
It worked! After all this, we finally have the magic command. At this point, you have full root access to the hotspot, and can do basically anything you want.
If you were paying close attention, you might have noticed that the first two bytes (0x16 0xf9) of the command match what the debug mode button says in the first place! (as can be seen at the screenshots at the beginning of the article) Despite that, this effort was still useful to figure out how the bytes are actually sent. It also means that you can probably figure out how to switch it into “diag mode” instead of debug mode, since that button also has its command printed on it. 15
Also, this only works because the debug protocol was fairly simple. Once we found the magic command, we could just repeat it ourselves. If the debug protocol were more complicated (for example, if the command varied based on some parameter, such as the current time), then we would need to perform a more in-depth analysis of the program.
One final note: you use adb—as in, the Android Debug Bridge—to access the shell. The hotspot doesn’t run Android, but it seems to still use adbd, along with a few other components from Android. Investigating everything that’s running on the hotspot, though, is probably a subject for a future blog post.
-
The only reference I can find to this is on a Russian forum, and they don’t explain where it came from. It’s only slightly sketchy. (that link is for the MW40, but it appears to work for a number of hotspots, including the MW41) ↩
-
This is a pretty similar idea to strace on Linux. However, all the code here runs in user mode, and we’re just watching when we go across the boundary between two separate DLLs. strace, on the other hand, monitors system calls, where we request a service from the kernel. A closer Linux analogue would be ltrace. ↩
-
150 MB, to be precise! ↩
-
The log itself has double the backslashes (
\\\\.\\F:), since it’s escaping them to be inside the double quotes. ↩ -
One thing that I didn’t address is what happened to the
\\.\PHYSICALDRIVE%cstring. (I later found out that it’s another way to address a drive in Windows, using its index rather than drive letter.) Presumably, this string was used in some other component of the tool. ↩ -
Note that DeviceIoControl isn’t actually implemented in the tool! It’s just a reference to the external function in
KERNEL32.DLL. ↩ -
Normally, the addresses of functions would be randomized due to ASLR. However, GDB disables ASLR automatically, so we don’t have to worry about that. ↩
-
A calling convention is a set of rules that, among other things, tell you where function arguments and return values go. ↩
-
The examine command we use here,
x/10x $sp, tells GDB to print 10 hexadecimal words, starting from thesp(stack pointer) register. This works because, on x86, the stack grows downwards. You can learn more about the stack here. ↩ -
In Windows, ULONG refers to a 32-bit integer. In addition, we’re debugging a 32-bit application, meaning
PVOIDis also 32 bits long. ↩ -
The x86 architecture is little-endian, so the bytes
0xc0 0x00 0x00 0x00are interpreted as 32-bit integer0x000000c0. ↩ -
On Ubuntu, this is provided by the
sg3-utilspackage. ↩ -
This is probably either 1 or 2. You can use
ls /dev/sg*to see all the SCSI devices connected to your computer. ↩ -
I believe that “diag” in this context refers to Qualcomm’s DIAG protocol; however, this is still something I’m looking into. ↩